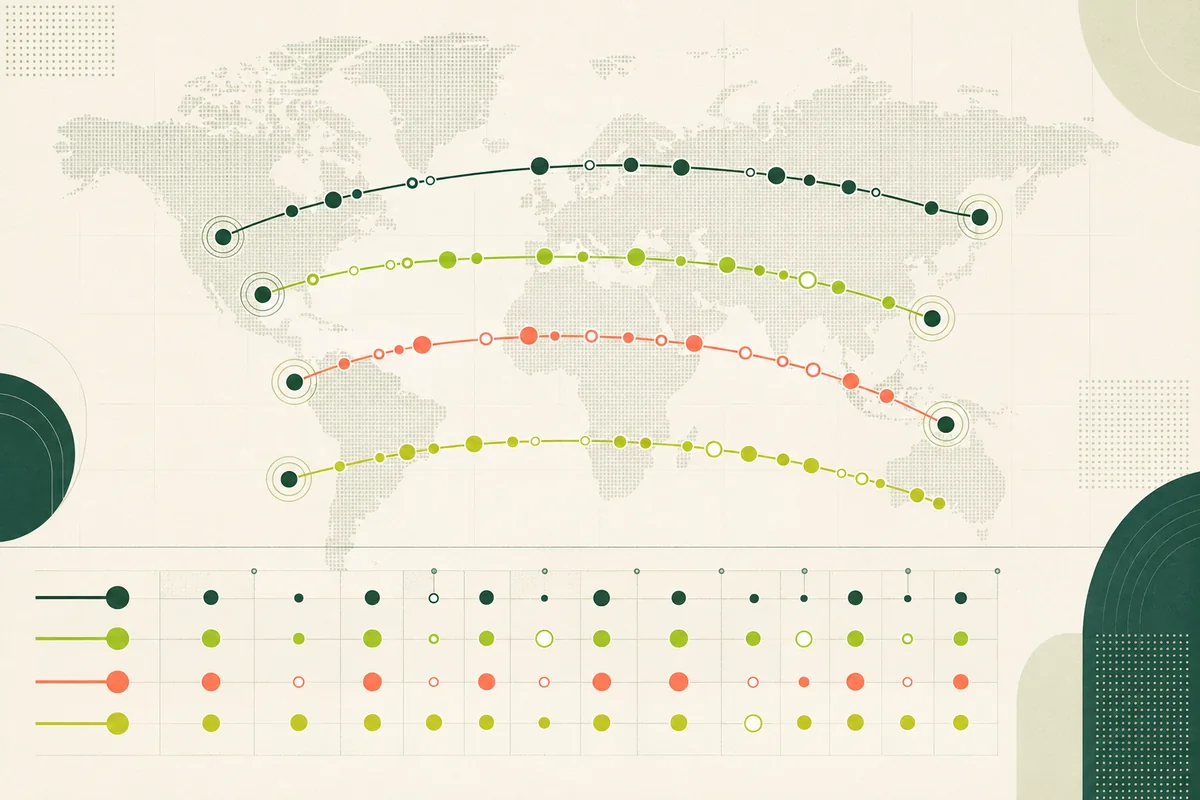
What the index measures
We selected four routes with broad public coverage and retrieved every archived observation for August. A set exists only where at least two providers share the same date, route, amount, offer mode, funding method and payout method.
The index measures displayed recipient outcomes. It does not infer successful payment, recipient arrival time or customer satisfaction.
Why there is no single average price
Destination currencies have different units, so raw recipient amounts cannot be averaged across corridors. Amounts and payout rails also differ. We therefore publish matched-set counts and provider-level results only inside their eligible comparisons.
A provider with broad route coverage can have many more checks than a focused provider. Win percentages without denominators are not comparable.
What the sample establishes
The sample is large enough to demonstrate that exact matching is practical and that price leadership depends on configuration. It supports route-level shortlisting and the related zero-fee, promotion and amount studies.
It does not support a global best-provider label. The live calculator remains the decision surface for a current transaction.
How to reproduce it
Use the public statistics export for each named route and date range. Filter confidence and source, deduplicate the provider key, group exact comparison keys, then retain groups with two or more providers.
The repository includes scripts/analyze-guide-research.mjs, which fetches the public API and prints the snapshot used by these reports.
How this result was produced
Eligible rows used high or medium confidence and an API or HTML source. We retained one provider row per exact key using confidence, source quality and recipient amount, then required at least two providers.
These are quote observations, not completed transfers. Results apply only to the named routes, dates, amounts and methods; they do not predict a future quote or measure delivery reliability.